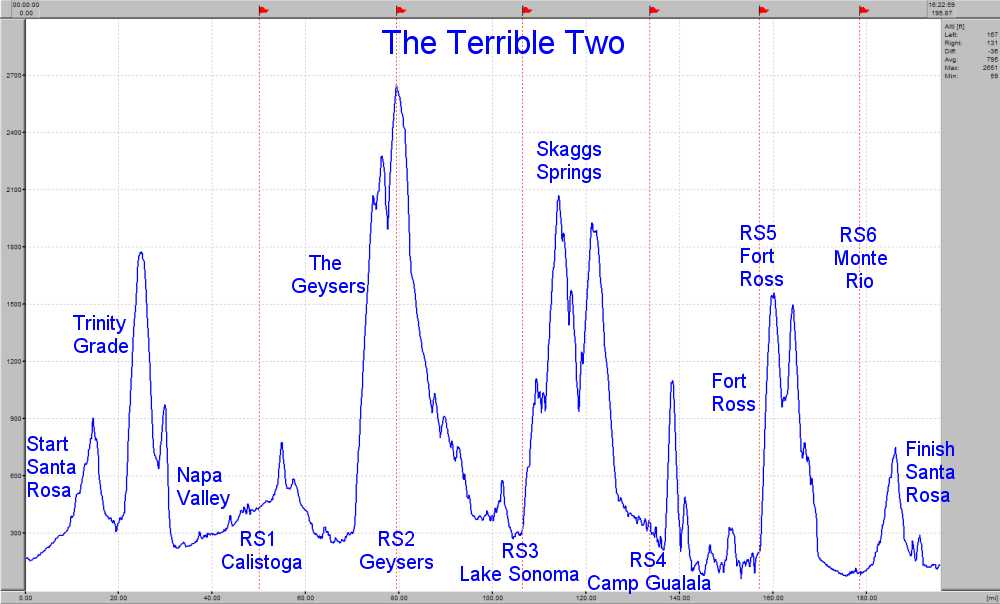
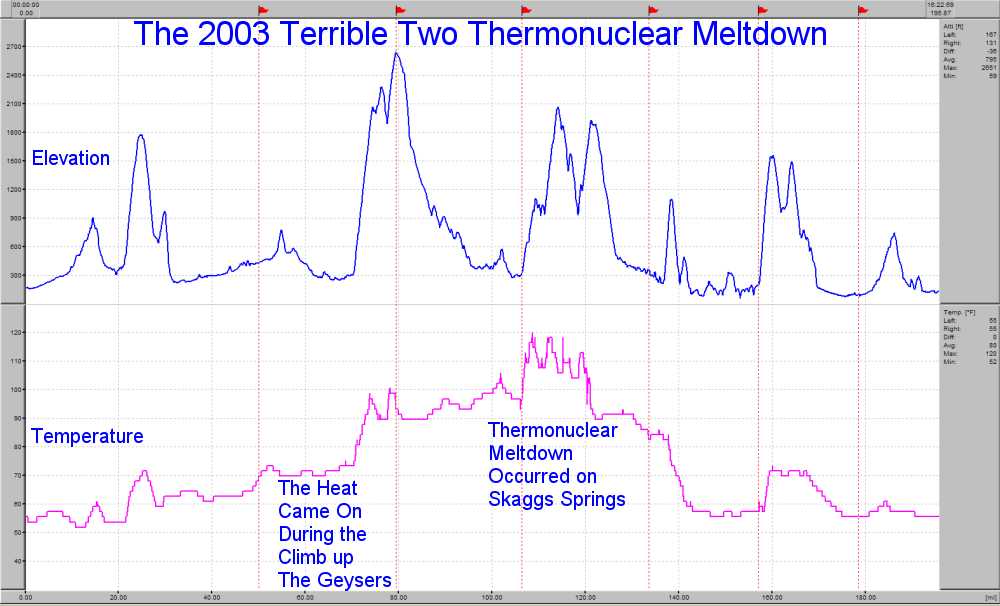
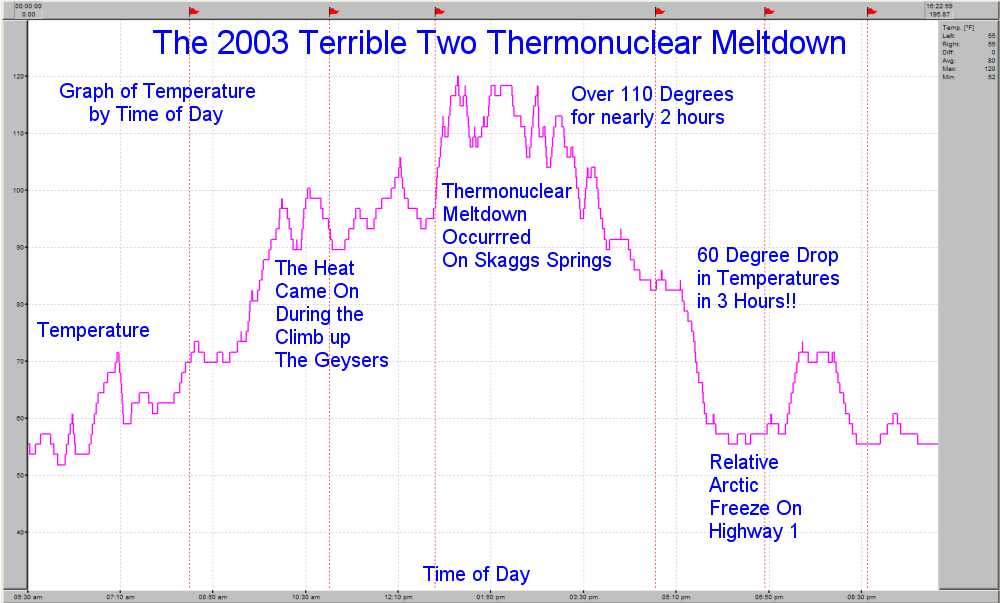
These graphs were built using my Ciclosport HAC4 Computer based on Terrible Two of June 28, 2003. The Terrible Two was started in 1976 by the Santa Rosa Cycling Club as they realized that a 200 mile course in and around Sonoma County would include some very challenging hills as well as some spectacular scenery. Although the route has varied in small ways over the years, its defining features have always been its four big climbs (and the steep, twisting descents that follow): Trinity Grade, the Geysers, Skaggs Springs, and Fort Ross. Numerous smaller but pesky hills add to the overall challenge. Trinity, the Geysers, and Fort Ross are all double-summit climbs, while Skaggs Springs is a long series of climbs and descents, including a tough new climb introduced with the 1995 route change. In 2003, we had brutally hot weather resulting in a Truly Terrible Thermonuclear Meltdown with Horrific Temperatures of 120 degrees recorded on my handlebar as I was walking my bike up the climbs in the soaring sun of Skaggs Springs. |
| % | |||||
| Feet of | % | % | Miles -� | ||
| Mile on | Climbing | Miles | Climbing | Climbing | |
| HAC4 | HAC4 | Completed | Completed | Completed | |
| Start | 0.0 | 0 | 0.0% | 0.0% | 0.0% |
| Start of Trinity Grade | 27.6 | 2210 | 14.1% | 14.3% | -0.2% |
| Calistoga Rest Stop | 50.0 | 2890 | 25.5% | 18.7% | 6.8% |
| Start of Geysers | 70.1 | 3410 | 35.8% | 22.1% | 13.7% |
| Geysers Rest Stop | 79.4 | 6220 | 40.5% | 40.3% | 0.2% |
| Lunch | 106.4 | 6920 | 54.3% | 44.9% | 9.5% |
| Camp Gualala Rest Stop | 133.6 | 9350 | 68.2% | 60.6% | 7.6% |
| Top of "The Wall" | 138.2 | 11300 | 70.5% | 73.2% | -2.7% |
| Fort Ross Rest Stop | 157.0 | 12450 | 80.1% | 80.7% | -0.6% |
| Start of Fort Ross #2 | 162.7 | 13850 | 83.1% | 89.8% | -6.7% |
| Monte Rio Rest Stop | 178.6 | 14470 | 91.2% | 93.8% | -2.6% |
| Finish | 195.9 | 15427 | 100.0% | 100.0% | 0.0% |