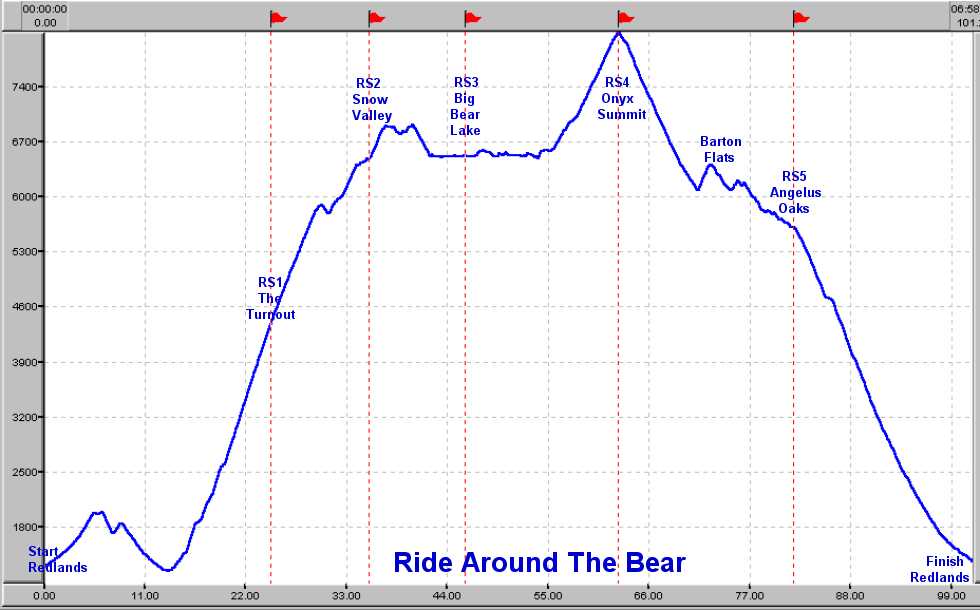
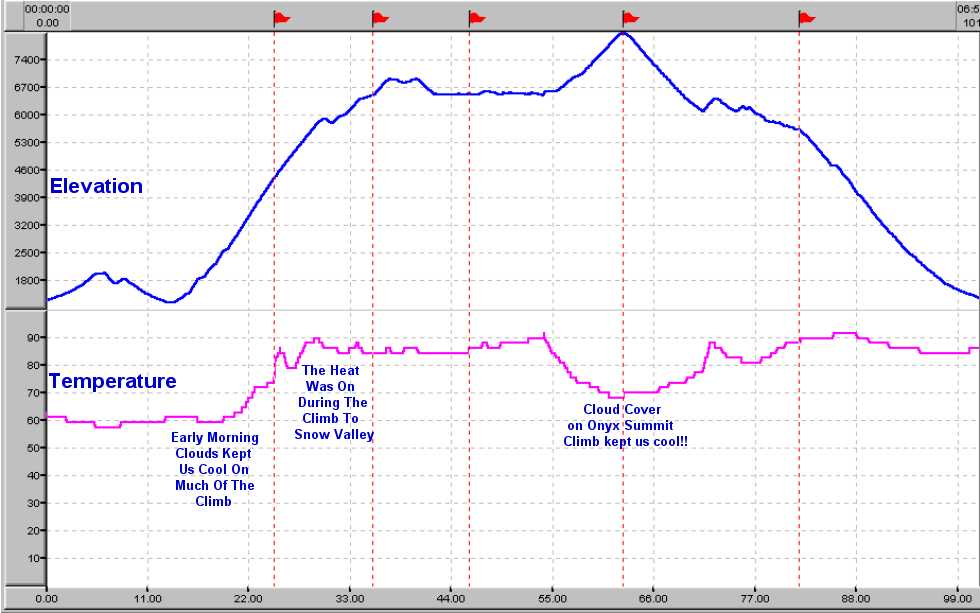
These graphs were built using my Ciclosport HAC4 Computer based on Orange County Wheelmen's Ride Around The Bear of June 7, 2003. The Ride Around The Bear has a long and great history. It has been rated "One of the Top Ten Most Difficult Centuries in the Country" by Cyclist Magazine in 1987 and California Cyclist in 1988!! In 2003, we had great weather all the way with temperatures between 57 and 91 as the graph below shows. |
| Date | Name | Avocet 50 Feet of Climbing |
Cateye CC-AT100 Feet of Climbing |
Ciclosport HAC4 Feet of Climbing |
Polar S710 Feet of Climbing |
|
| 06/11/94 | Frank Neal | 9000 | ||||
| 06/10/95 | Frank Neal | 9090 | ||||
| 06/15/96 | Chuck Bramwell | 9090 | ||||
| 06/06/98 | Chuck Bramwell | 9340 | ||||
| 06/06/98 | Frank Neal | 9000 | ||||
| 06/12/99 | Chuck Bramwell | 9120 | ||||
| 06/12/99 | Frank Neal | 9800 | ||||
| 06/10/00 | Chuck Bramwell | 9220 | ||||
| 06/10/00 | Frank Neal | 9890 | ||||
| 06/09/01 | Chuck Bramwell | 9070 | ||||
| 06/09/01 | Frank Neal | 9790 | ||||
| 06/08/02 | Chuck Bramwell | 9030 | ||||
| 06/08/02 | Frank Neal | 9960 | ||||
| 06/07/03 | Chuck Bramwell | 8980 | ||||
| 06/07/03 | Alex Irizari | 9081 | ||||
| 06/07/03 | Cheryl Scherr | 9281 | ||||
| **** Averages | 9107 | 9860 | 8980 | 9181 | ||
| **** % over Avocet Feet of Climbing | 8.3% | -1.4% | 0.8% | |||
| **** Average of All Readings | 9296 | |||||
| Mile on HAC4 |
Feet of Climbing on HAC4 |
% Miles Completed |
% Climbing Completed |
|
| Start | 0.0 | 0 | 0.0% | 0.0% |
| Elevation 3000 Sign | 20.7 | 2510 | 20.4% | 28.0% |
| RS1 at Turnout | 24.8 | 3960 | 24.5% | 44.1% |
| Elevation 5000 Sign | 26.2 | 4400 | 25.8% | 49.0% |
| Elevation 6000 Sign | 29.5 | 5340 | 29.1% | 59.5% |
| RS2 at Snow Valley | 35.5 | 6130 | 35.0% | 68.3% |
| Elevation 7000 Sign | 36.4 | 6340 | 35.9% | 70.6% |
| RS3 at Big Bear Lake | 45.9 | 6670 | 45.3% | 74.3% |
| Elevation 7000 Sign | 56.3 | 7090 | 55.5% | 79.0% |
| Elevation 8000 Sign | 60.8 | 7990 | 60.0% | 89.0% |
| RS4 at Onyx Summit | 62.7 | 8410 | 61.8% | 93.7% |
| Elevation 8000 Sign | 64.5 | 8410 | 63.6% | 93.7% |
| Elevation 7000 Sign | 68.1 | 8410 | 67.2% | 93.7% |
| Elevation 6000 Sign | 79.5 | 8920 | 78.4% | 99.3% |
| Finish | 101.4 | 8980 | 100.0% | 100.0% |